
Quality by Design Reveals What Standard Process Development Misses
What it takes to build a cell therapy process that holds at scale
Between 2020 and 2024, 74% of Complete Response Letters issued by the FDA cited manufacturing or quality deficiencies as the primary reason for rejection. Statistically, your program is more likely to fail because of your process than your biology.
This is exactly where many promising cell therapy programs stall. Strong early signals are not enough when a process lacks robustness. Hidden sensitivities emerge at clinical stage, variability increases, investigations multiply, and corrective actions slow progress.
Today, regulatory success depends on product performance, but also on your ability to demonstrate that the therapy can be manufactured consistently, predictably, and at scale. If the process is not under control, the therapy does not move forward.
One of the main reasons for this gap is that process development is not done taking the full picture, because it relies on a One Factor At a Time (OFAT) approach. That method treats process parameters as if they operate independently. In cell therapy, they do not. Process performance is shaped by interactions between variables, and when those interactions are not characterized, risk remains built into the process from the start.

5
Critical Parameters
mapped simultaneously
4
Critical Quality Attributes
evaluated in parallel
5
Months
to a robust process

Our Approach: Quality by Design through Design of Experiments
Quality by Design (QbD), as defined in ICH Q8 and supported by the FDA and EMA, provides a more comprehensive framework for understanding process behavior.
At Cell Easy, we use this approach to evaluate how process parameters jointly influence your final product’s quality across a range of conditions. We start by identifying the Critical Quality Attributes (CQAs) that define what your process must consistently achieve. Then, we conduct a risk assessment to identify the Critical Process Parameters (CPPs) most likely to impact them. Next, we use a methodology called Design of Experiments (DoE) to study these parameters simultaneously and identify interactions between them. This allows us to define a range of operating conditions within which your product’s quality remains consistent despite variability.

A concrete example: QbD applied to the cryopreservation of an MSC product
Cryopreservation is often treated as a standard step. In practice, it concentrates multiple sources of variability within a narrow quality window and limited opportunity for correction once scaled.
The methodology
01. Defining the specifications
The starting point was to define the CQAs for this MSC product, along with quantitative acceptance criteria to evaluate post-thaw performance. Four CQAs were selected:
- Post-thaw viability > 92%
- Yield > 90%
- 24-hour recovery > 110%
- Apoptotic cells < 25%
These thresholds were defined based on internal process knowledge and used as decision criteria to discriminate between acceptable and suboptimal cryopreservation conditions during development.
02. Mapping the parameter space
Five critical process parameters (CPPs) were studied simultaneously: Freezing program, Cell Concentration, Vial Volume, DMSO Concentration and Total Waiting Time.
A statistically designed set of experiments was performed to build a predictive model describing the impact of these parameters on all four CQAs. This model was then used to simulate a large number of parameter combinations, allowing us to explore the design space beyond the experimentally tested conditions and identify robust operating regions.
Key Findings
U-shape Freezing Program Outperforms V-shape Across All Process Parameters
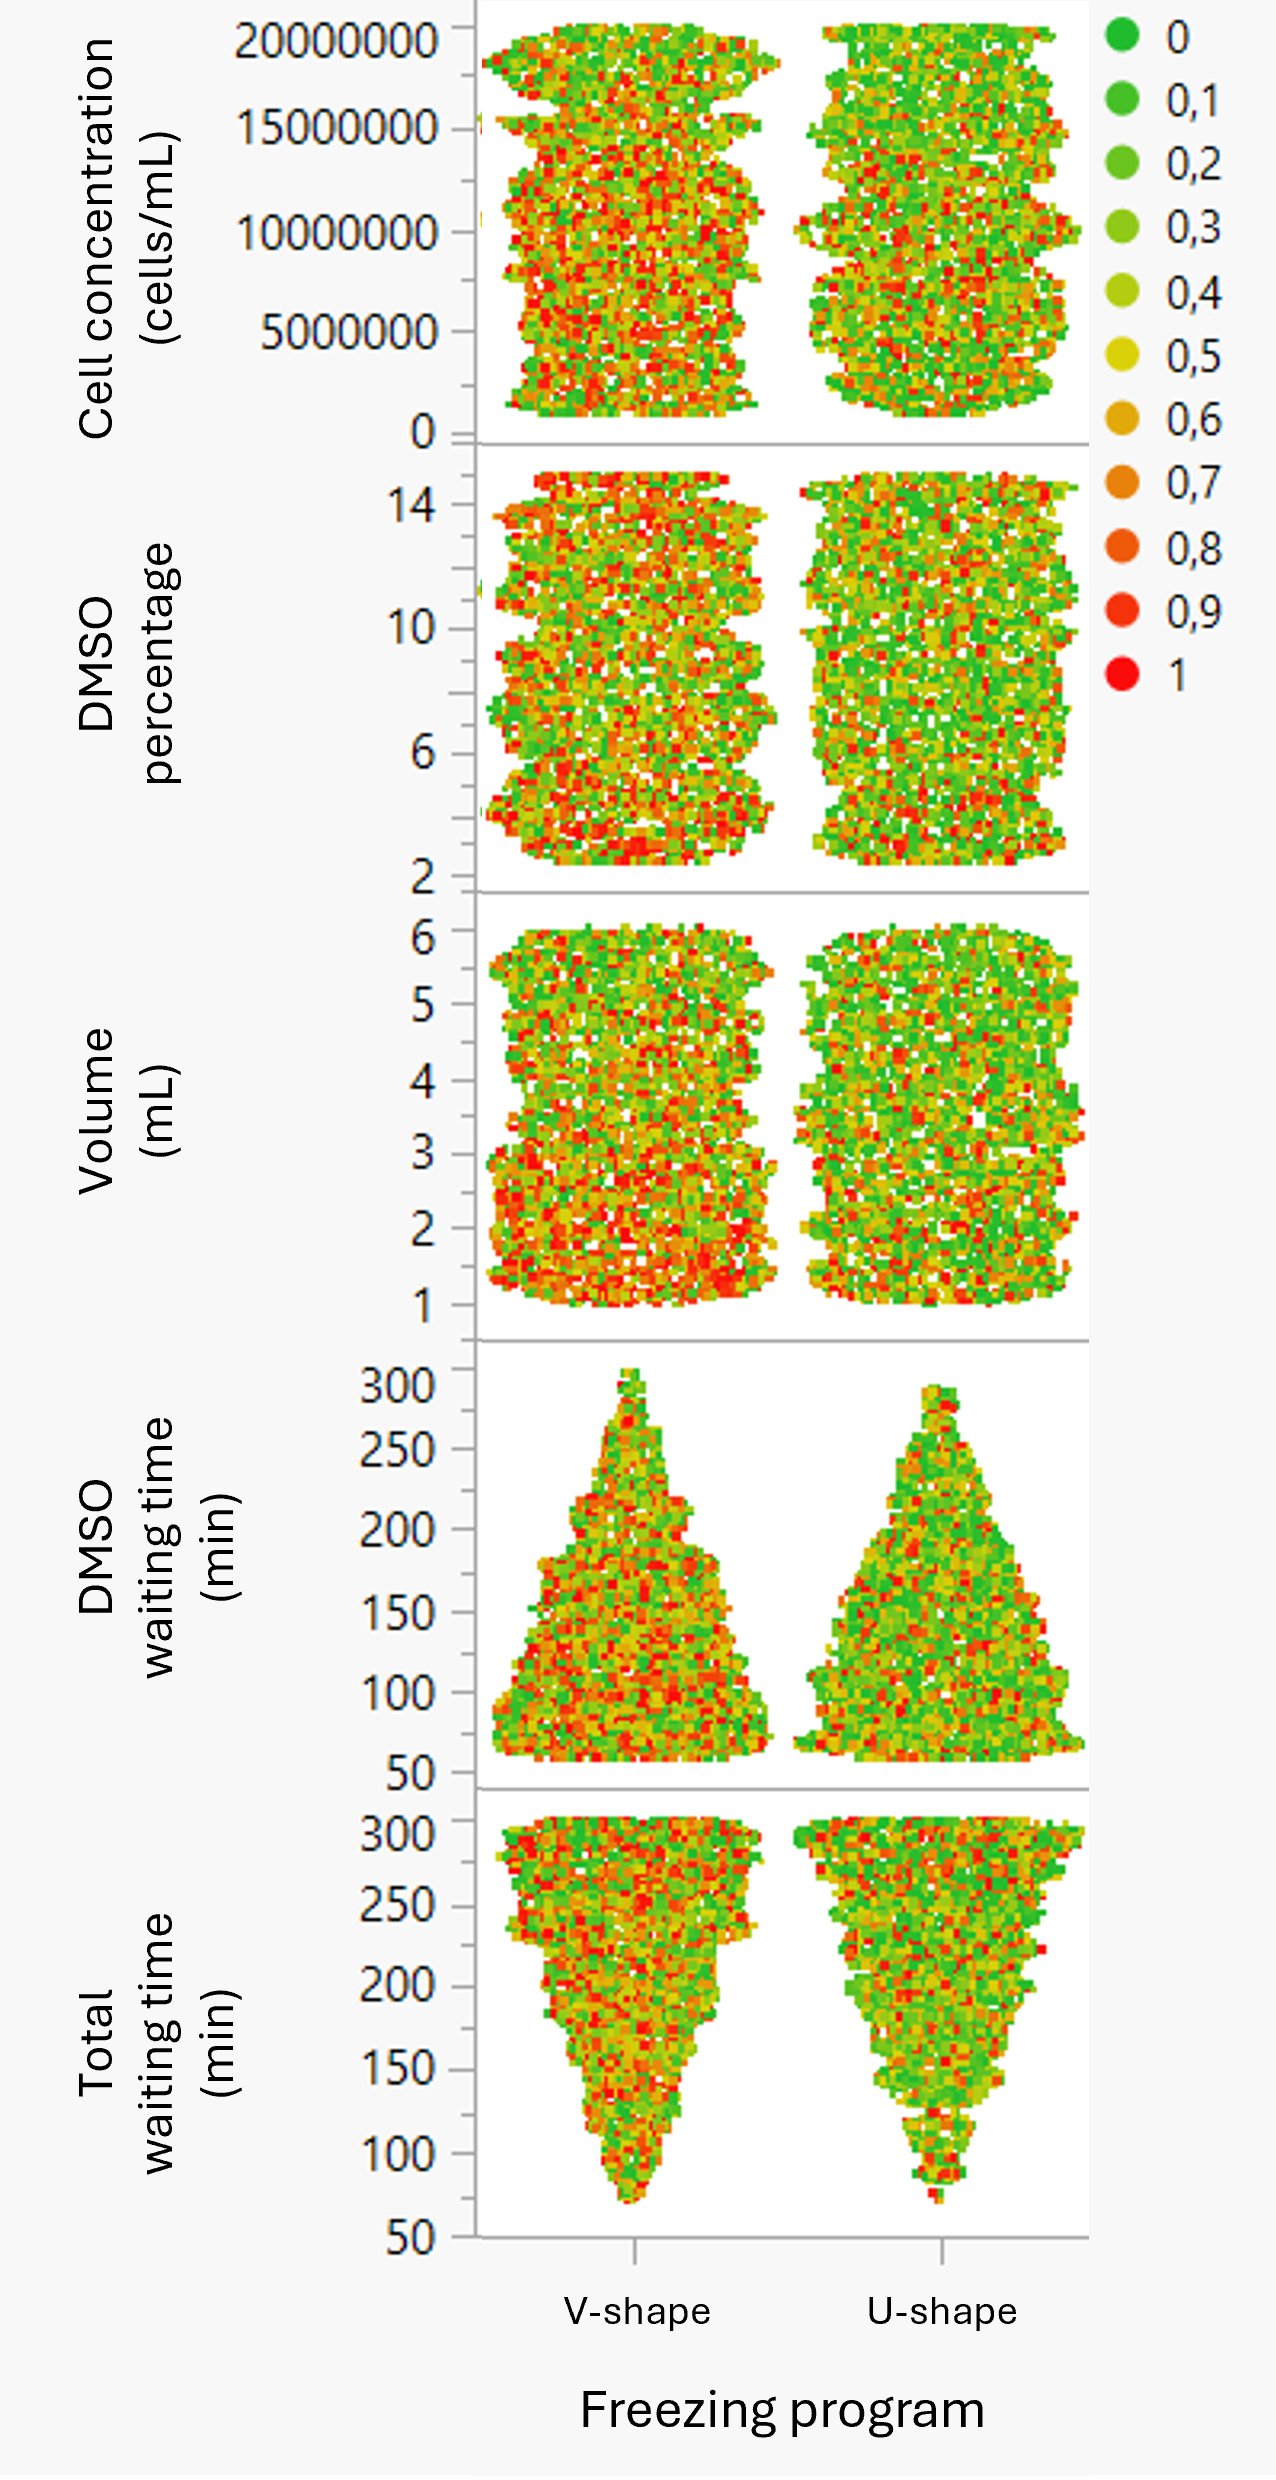
The cooling curve shape controls ice formation dynamics and the cellular stress that cells experience during freezing. We compared two profiles: a V-shape, which drops temperature rapidly, and a U-shape, which transitions more gradually through the critical temperature range.
The figure shows how the freezing profile interacts with key process parameters—cell concentration, DMSO concentration, vial volume, and total waiting time—and how these combinations affect the four CQAs. Each point represents a simulated condition. Green points mark conditions where all CQAs meet the acceptance criteria, while red points indicate failures.
Across all parameter combinations, the U-shape profile produces a higher proportion of acceptable conditions. This demonstrates that the process tolerates variability in key parameters more effectively. In contrast, the V-shape profile only meets specifications within narrower conditions, making the process more sensitive to fluctuations.
Figure 2: Design space distribution across key process
parameters for V-shape and U-shape freezing programs
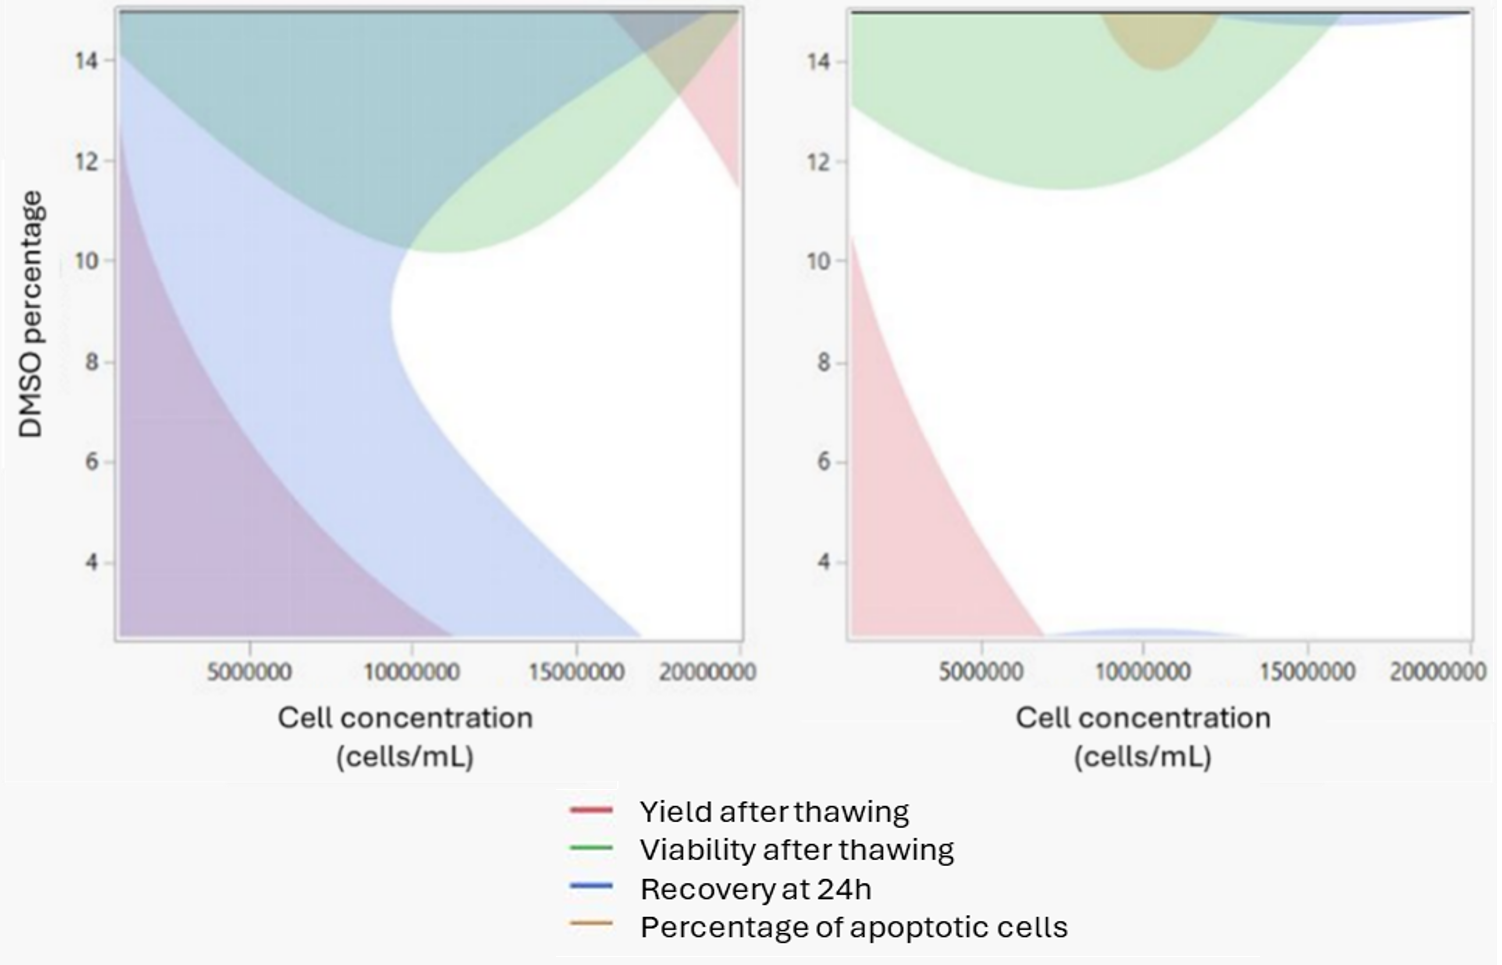
Higher Cell Concentration Increases Tolerance to Both Process Time and DMSO percentage
Cell concentration at the time of freezing directly affects how robust the process remains against variations in DMSO exposure and total handling time. We evaluated concentrations from 1 to 20 × 10⁶ cells/mL.
Each figure maps DMSO percentage against total waiting time. Colored regions show conditions where at least one CQA fails, while the white area marks the combination of conditions that meet all four acceptance criteria simultaneously.
At 1 × 10⁶ cells/mL, the white space nearly disappears. At 20 × 10⁶ cells/mL, it expands substantially, allowing longer process times and higher DMSO concentrations without violating specifications. In particular, increasing cell concentration enables total waiting times up to 220 minutes while maintaining all CQAs within acceptable limits. For this MSC process, we need to maintain at least 10 × 10⁶ cells/mL to preserve a robust operating space. Lower cell densities make the process highly sensitive to variations in handling time or DMSO exposure, providing minimal buffer under real manufacturing conditions.

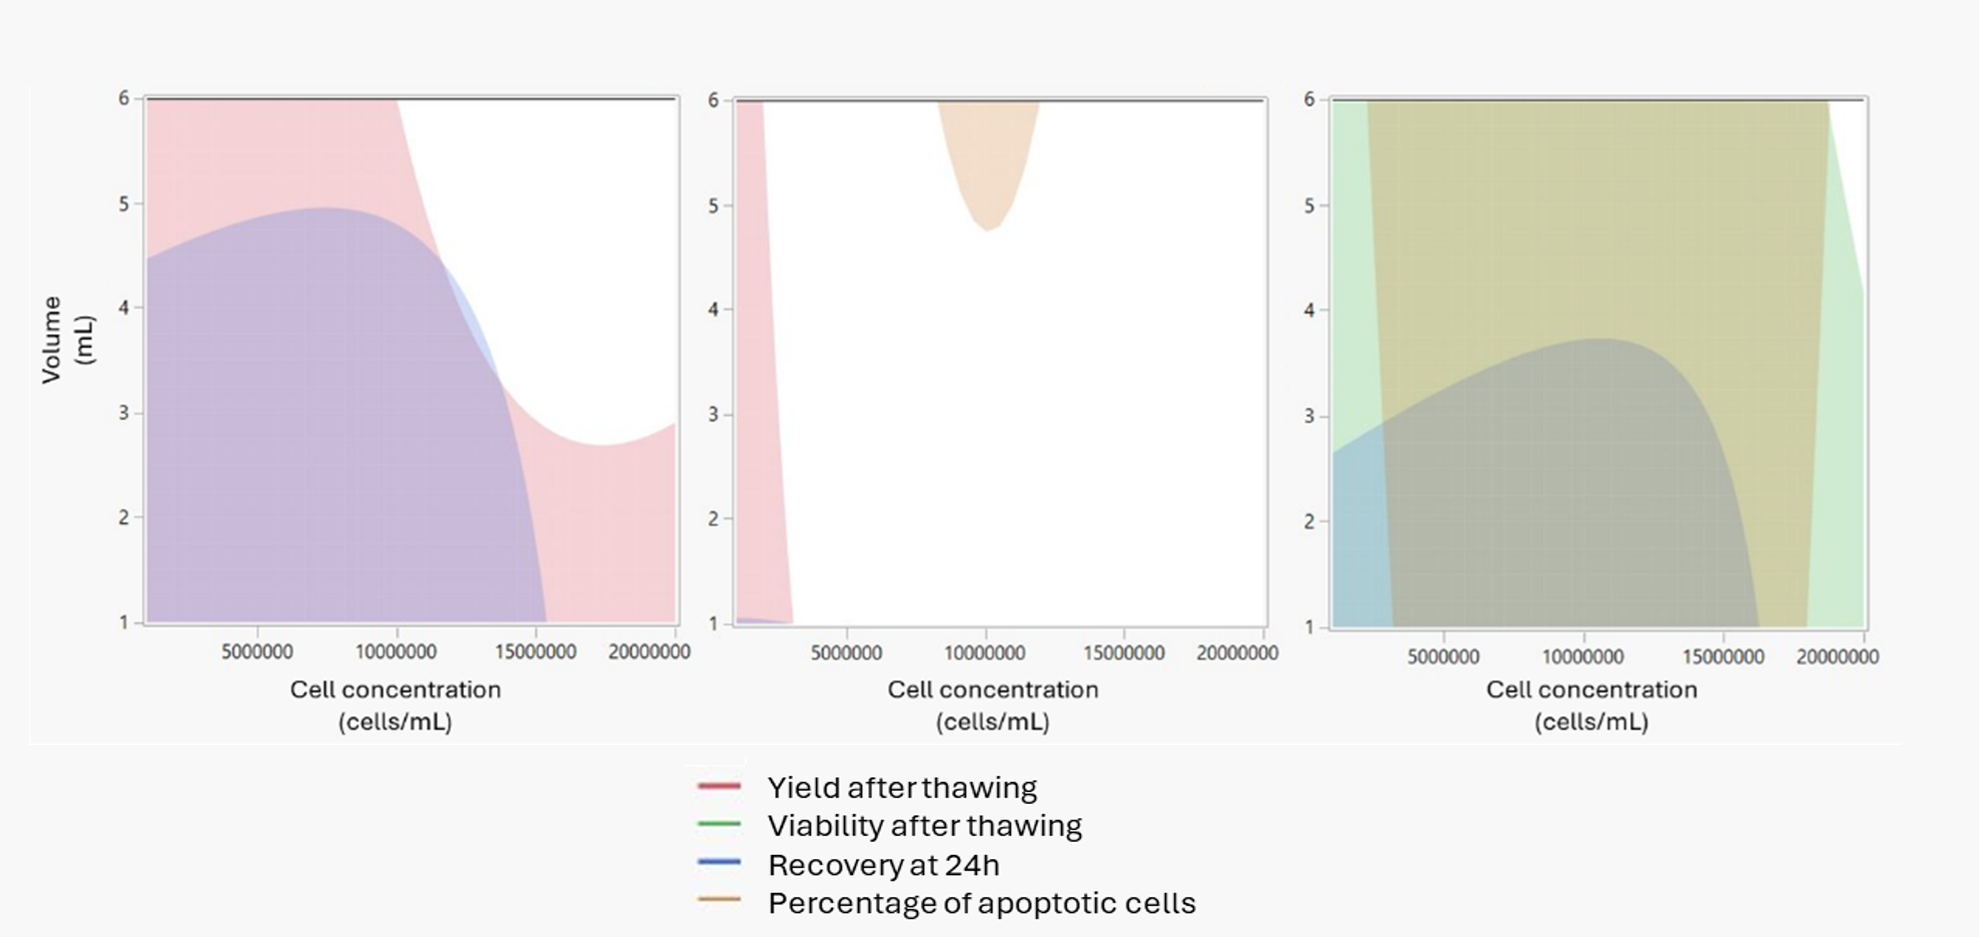
Larger Vial Volumes Expand DMSO Tolerance
Vial volume affects thermal uniformity during freezing. Small volumes freeze rapidly and unevenly, while larger volumes allow the cooling front to propagate more gradually and homogeneously through the sample. We evaluated volumes from 1 to 6 mL.
At 1 mL, the robust operating space remains narrow, limited to a restricted combination of cell concentration and DMSO percentage. At 6 mL, the space expands substantially, accommodating a much wider range of DMSO concentrations. For this MSC process, maintaining vial volumes above 4.5 mL ensures sufficient room to stay within specifications even when filling conditions vary. Increasing cell concentration further widens this space, as discussed above.
DMSO Concentration Peaks in Effectiveness Between 5.5% and 10%
DMSO acts as both the primary cryoprotectant and the main source of process-related cytotoxicity. Optimizing its concentration requires balancing these opposing effects. We evaluated a range from 2.5% to 15%.
Each figure maps vial volume against cell concentration at a fixed DMSO level. At 2.5%, only a narrow combination of vial volume and cell concentration meets all four CQAs. The operating space expands at 8,3% across a much wider range of conditions. At 15%, toxicity reduces the space, overriding the cryoprotective effect.
For this MSC process, the optimal DMSO range lies between 5.5% and 10%, where protection is sufficient and toxicity remains controlled. This demonstrates why developing the process at a single DMSO concentration, without defining the operating space, leaves it highly sensitive to small deviations.
The Design Space

OFAT vs. QbD: What the Difference Looks Like in Practice
The table below compares the two approaches across dimensions that directly affect program outcomes.
| OFAT | QbD / DOE | |
| Factor interactions detected | ✗ | ✓ |
| Number of experimental runs | High | Optimized |
| Predictive model generated | ✗ | ✓ |
| Design Space defined | ✗ | ✓ |
| ICH Q8 compliance | Difficult | Native |
| Global optimum reached | Rarely | Likely |
| Scale-up robustness | Weak | Built-in |
| Regulatory dossier strength | Weak | Strong |

What this means for your program
This case study illustrates a fundamental reality of cell therapy development: success is not only about scaling production, but about understanding and controlling how your process behaves across a range of conditions. If a process is developed around isolated parameters rather than their interactions, critical sensitivities often remain hidden until late stages when they become costly, time-consuming, and difficult to resolve.
Think about your own process: do you fully understand which parameters most influence product quality? Could small variations in materials or handling impact outcomes more than you realize? How confident are you that your process will perform reliably under GMP conditions?
If these questions raise concerns, feel free to reach out to us. We can run a short process assessment.
Let’s talk about your project
Let’s turn your vision into a reality.

Phone: +33 534 276 550

Address: Cell-Easy SAS, 4 bis avenue Hubert Curien,
31100 Toulouse, France

Mail: info@cell-easy.com

